> For the complete documentation index, see [llms.txt](https://docs.forestall.io/fsprotect/llms.txt). Markdown versions of documentation pages are available by appending `.md` to page URLs; this page is available as [Markdown](https://docs.forestall.io/fsprotect/dashboard.md).
# Dashboard
Dashboard provides a general and holistic view of the identity security posture across scanned environments based on different perspectives.
## Scan Context
The band at the top of the page names the scan the figures belong to and describes its scope as a row of chips: the policy that produced the scan, and the forests and domains it covered. When a scan covers more scopes than fit on one line, the remainder is collapsed into a **+N More** chip.
Two selectors sit on the right of the band:
**Provider:** Chooses which provider the dashboard reports on. The list shows only the providers present in the selected scan, under an `In this scan` heading, each with the number of issues found for it, and can be filtered by typing. The cards below the band change with the selection, so an Active Directory dashboard shows users, computers, groups and GPOs while an AWS dashboard shows users, policies, roles, access keys and groups.
**Compare:** Chooses another scan to compare the current one against.
The chips follow the selected provider, so they describe the scope in that provider's own terms: an Active Directory selection shows the forests and domains covered, while an AWS selection shows the accounts, for example `Accounts - 834922934926 (Commercial)`.
## Risk by Scope
Risk by scope breaks the scan down by the scopes it covered, so a scan spanning more than one forest or domain shows where the risk actually sits. The heading carries the number of scopes.
Risk by scope
**Scope:** The forest or domain the row is about, linking to its entity page.
**Risk:** The risk score calculated from that scope's own findings, drawn as a gauge.
**Exposure:** The exposure points accumulated within that scope.
**Affected objects:** How many objects in the scope have at least one issue, out of the number of objects scanned for it.
**Issue Counts:** The issues found in the scope, as one badge per severity.
{% hint style="info" %}
Each scope is scored on its own findings, so the scope risks do not add up to the scan score, and a finding that reaches two scopes is counted in both.
{% endhint %}
The same figures for a single domain are shown on that domain's [Domain scope](/fsprotect/unified-identities/ad-identities/domains.md) card.
## Over-privilege Audit Logging
Over-privilege audit logging reports how much of the environment the [Over-Privilege Analysis (Beta)](/fsprotect/scans/policies/policies.md) module was actually able to judge. A permission can only be marked **Actively in use** if the object's SACL audits it, so an object with no auditing produces no evidence either way, and an unused permission cannot be told apart from an unobserved one.
Over-privilege audit logging
The heading carries the number of objects checked. The bar splits them three ways:
**No logging:** Objects whose SACL audits nothing. Permissions on these objects can never be confirmed as in use.
**Partial logging:** Objects whose SACL audits some, but not all, of the access the analysis needs.
**Full logging:** Objects whose SACL audits everything the analysis needs.
Auditing needs both halves: the SACL on the object, and the audit policy on the domain controller. When controllers are missing their audit policies, a warning below the bar says how many, and links to the list of them in [Search & Reports](/fsprotect/search-and-reports.md).
{% hint style="info" %}
The card is shown for scans whose policy enables the Over-Privilege Analysis (Beta) module. The usage evidence it describes is what produces the `Actively in use` value on an issue's affected-entity table, which requires a [Splunk](/fsprotect/configuration-center/splunk.md) integration.
{% endhint %}
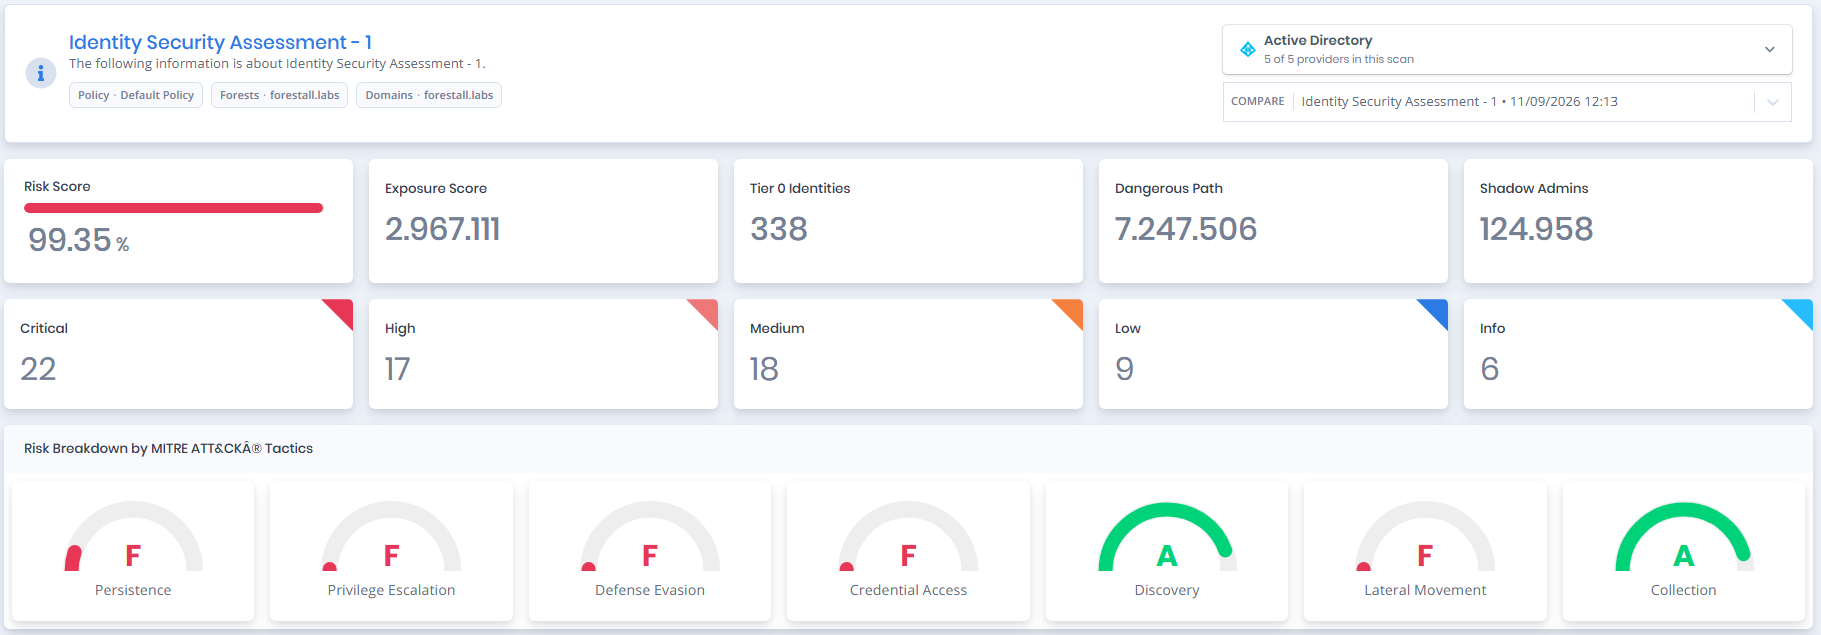
### Risk Score, Exposure Score, Dangerous Path Count, Shadow Admins,and Severities
**Risk Score:**\
Risk score is the primary indicator of the current identity security posture of scanned environments. It is calculated based on the number and severity of detected issues. A risk score of 100 indicates the presence of at least one issue that may lead to a full identity compromise.
**Exposure Score:**\
A metric that represents the overall level of exposure based on discovered misconfigurations, excessive permissions, and risky identity relationships.
**Dangerous Path Count:**\
Dangerous Path Count indicates the number of potential attack paths that could lead to the compromise of privileged identities through misconfigurations or indirect permission relationships.
**Shadow Admins:**\
The number of identities that effectively hold administrative privileges through indirect, inherited, or hard-to-detect permission assignments, posing a significant security risk.
**Critical**: The number of Issues with Critical severity.
**High**: The number of Issues with High severity.
**Medium**: The number of Issues with Medium severity.
**Low**: The number of Issues with Low severity.
**Info**: The number of Issues with Info severity.
### Risk Breakdown by MITRE ATT\&CK Tactics
Risk scores based on MITRE ATT\&CK Tactics mapping.
Risk Breakdown by MITRE ATT&CK Tactics
### Tier Analysis Statistics
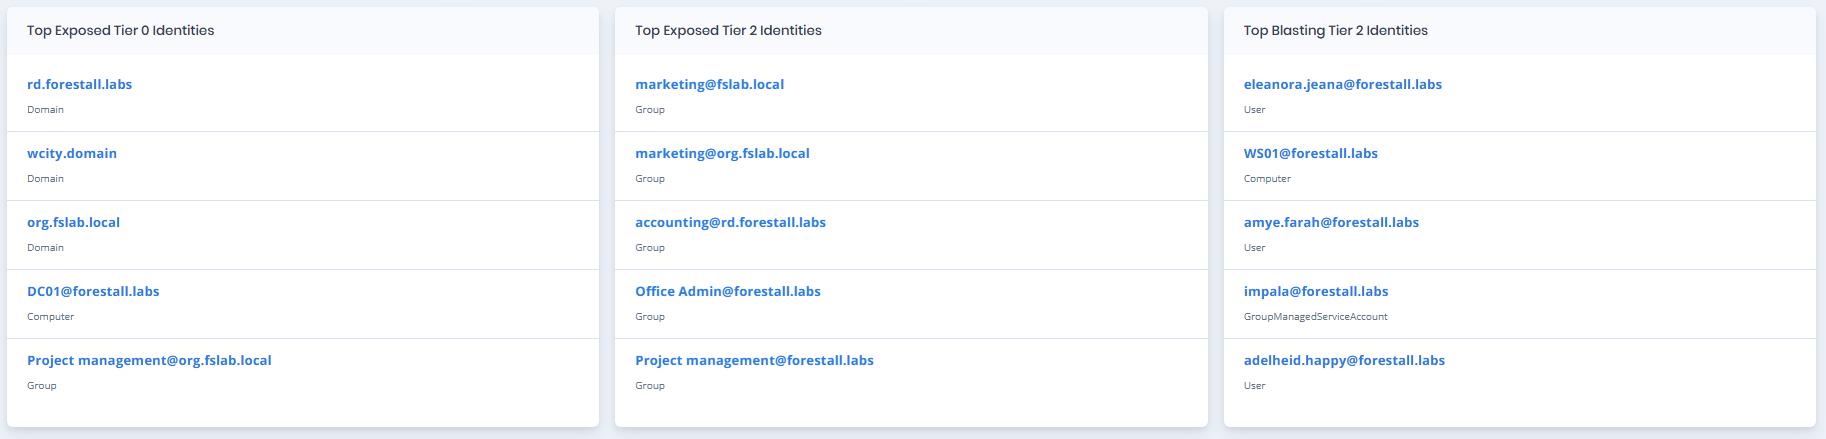
The Tier Analysis statistics highlight identities and objects that play an important role in attack paths leading toward Tier 0.
| Statistic | Description |
| ---------------------------------- | -------------------------------------------------------------------------------------------------------------------------------------------------------------------------------------------- |
| **Top Exposed Tier 0 Identities** | Shows up to five Tier 0 identities with the highest exposure to incoming attack paths. These objects act as important convergence points for paths that can reach Tier 0. |
| **Top Exposed Tier 2 Identities** | Shows up to five Tier 2 identities with the highest exposure to incoming attack paths. These objects represent significant bottlenecks along paths leading toward Tier 0. |
| **Top Blasting Tier 2 Identities** | Shows up to five Tier 2 identities with the strongest combined incoming and outgoing attack-path connectivity. These objects can both receive access and propagate it further toward Tier 0. |
Tier Analysis Statistics
### Top Choke Points
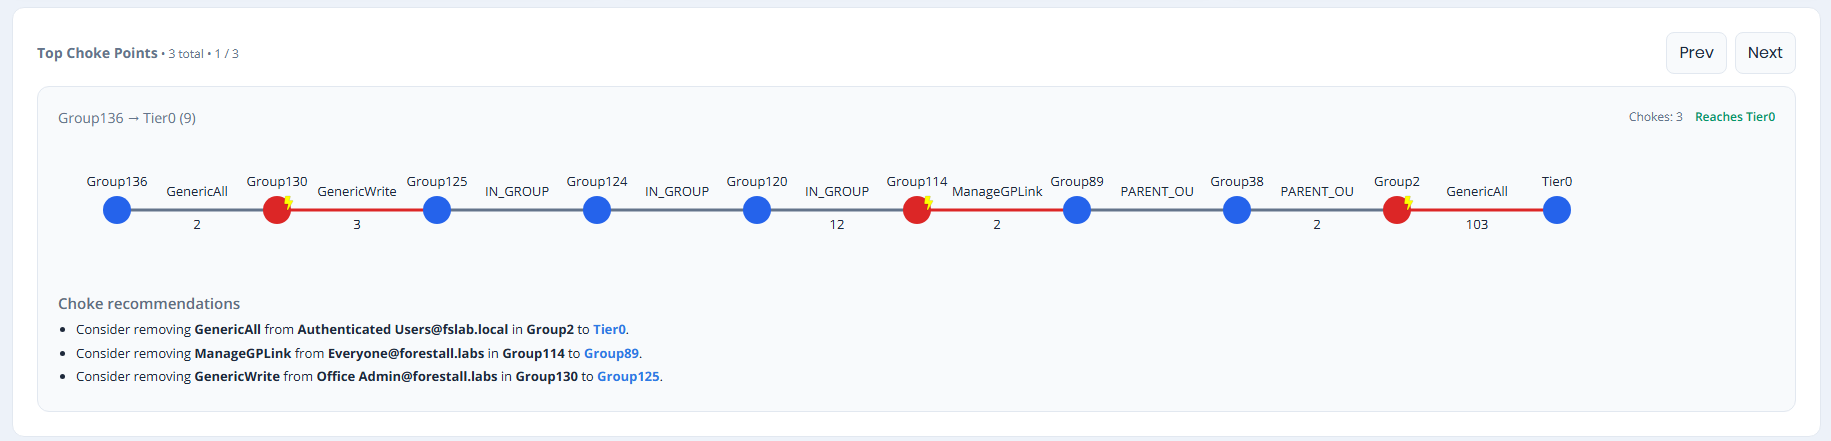
Top Choke Points highlights representative attack paths that contain important bottlenecks on the way to **Tier 0**.
Each path shows the relationships used to progress toward Tier 0 and highlights the points where multiple attack paths converge. **Chokes** indicates the number of identified choke points on the displayed path, while **Reaches Tier0** confirms that the path reaches a Tier 0 object.
The **Choke recommendations** section lists relationships that can be reviewed to help break the attack path. When multiple critical paths are available, **Prev** and **Next** can be used to navigate between them.